In short
- Melbourne is the one city on this site where a state program, Victorian Energy Upgrades, discounts a commercial solar system between 30kW and 200kW on top of the federal STC discount.
- Melbourne's panels also make the least power per kW of any city here, so a Melbourne factory needs a larger system for the same output, and a quote using Perth or Brisbane yields is wrong.
- Five distributors cover the city, each with its own export limits. The address decides the process.
For a Melbourne manufacturer, commercial solar in 2026 pays back in roughly two and a half to three years on a weekday-shift site before the Victorian Energy Upgrades discount, and faster with it. The lower sun is offset, in part, by the only state solar incentive in the country. This page covers what is specific to Melbourne. The shift-pattern sums, the 1 MW STC change and the tax position are on solar for manufacturing, and the city as a whole is on commercial solar Melbourne.
| Quick facts | Manufacturing solar in Melbourne |
|---|---|
| Networks | CitiPower, Powercor, Jemena, United Energy or AusNet Services, by street |
| STC zone | Zone 4, rating 1.185 |
| State incentive | Victorian Energy Upgrades discount on 30kW to 200kW systems |
| Example payback | 2.4 to 2.8 years at 100kW, before the state discount |
| What to send | one recent bill; we get the interval data from it |
What's different in Melbourne
1. Five distributors
Melbourne is the only city here split across five distribution networks: CitiPower in the inner city, Jemena in the north-west, Powercor in the west, United Energy in the south-east and AusNet Services in the outer east and north. Which one you are on depends on the street, and it changes the connection process, the export limit and the timeline. Dandenong and the south-east industrial belt are mostly United Energy; Laverton, Derrimut and Truganina in the west are Powercor; Campbellfield and Somerton are Jemena.
- Up to about 30kW: a routine connection on most Melbourne feeders.
- Around 100kW: a full application with a technical assessment on every Melbourne network. Some inner-city feeders are constrained enough that a system this size gets an export cap.
- Above 100kW: a detailed assessment and, usually, export limiting. Since 1 October 2026 a 100kW to 1MW system can take the upfront STC discount (mid-scale rules); above 200kW the Victorian Energy Upgrades discount moves to its project-based method.
2. The STC zone: Zone 4
Melbourne postcodes sit in STC Zone 4, rating 1.185, the lowest of the mainland capitals. A 100kW system installed in 2026 earns 100 × 1.185 × 5 = 592 certificates, against 691 for the same system in Sydney or Brisbane see the postcode zone table on the Clean Energy Regulator page. The upfront discount is smaller here, which is one reason the state program matters.
3. Victorian Energy Upgrades: the one state solar discount
Victoria is the only state with a standing commercial solar incentive. Through Victorian Energy Upgrades, a non-residential site can get an upfront discount on a solar system between 30kW and 200kW, delivered by an accredited provider who creates certificates for the installation. Larger systems go through the program's project-based activities. The discount's value moves with certificate prices, so we check it on the day rather than putting a number on this page. If you are also replacing lighting, refrigeration or compressed-air equipment, those can sometimes earn certificates in the same program, which is worth raising at the same time.
4. Melbourne's factories, and the sun they get
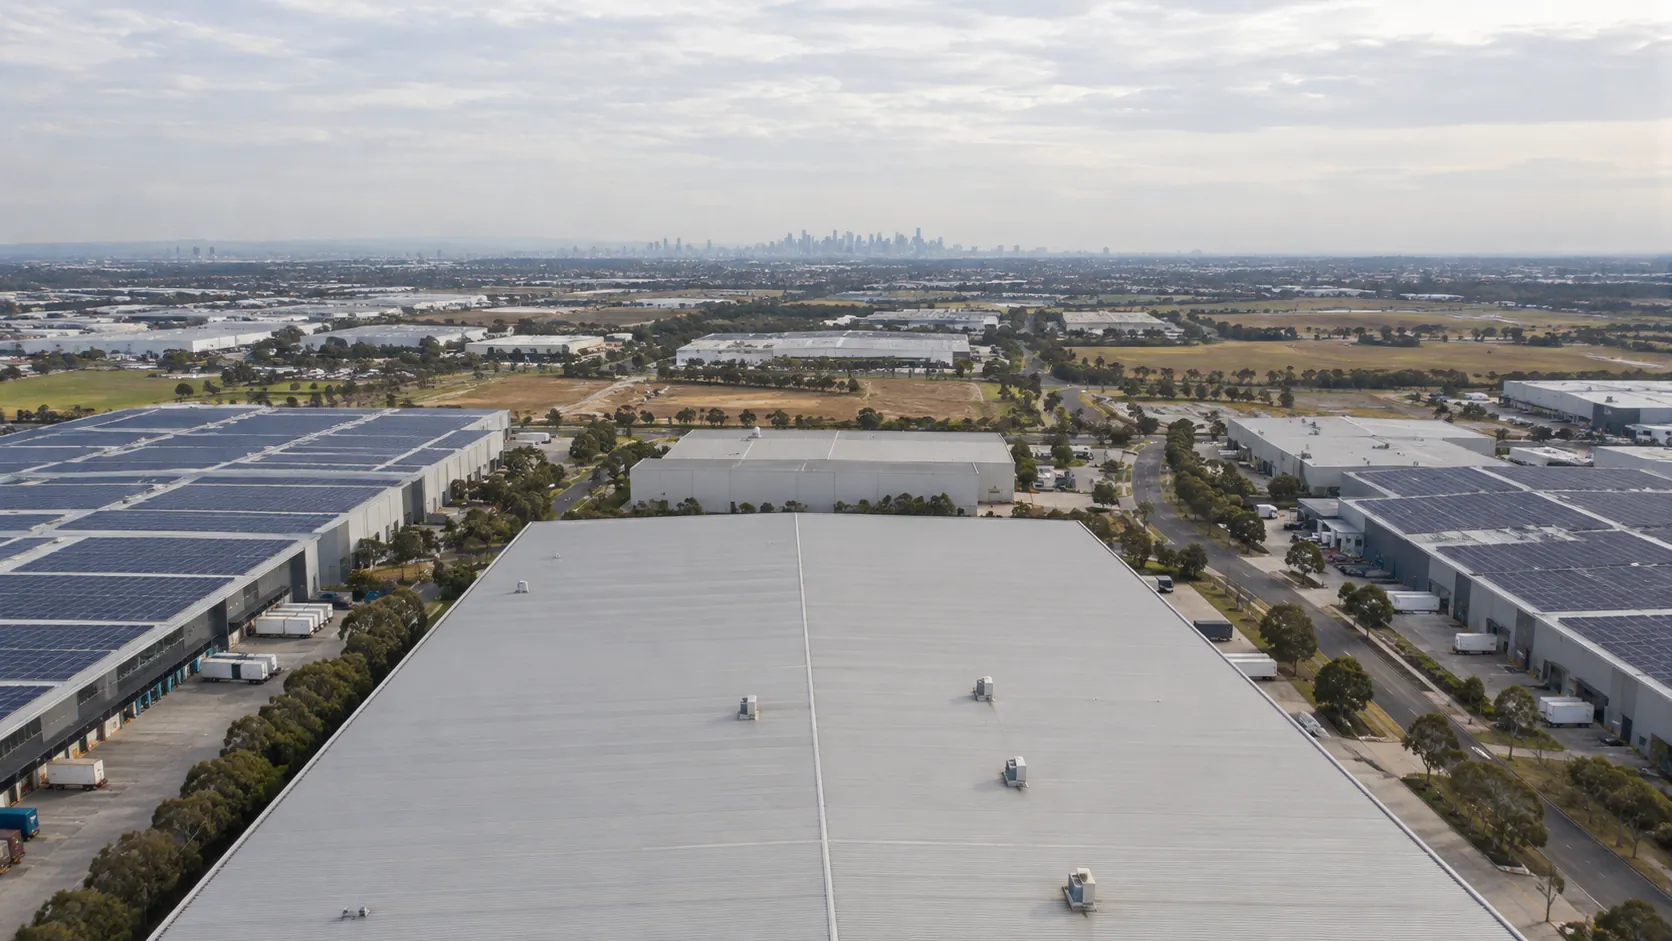
General knowledge, not a measurement: Melbourne's manufacturing sits in the south-east (Dandenong, Clayton, Moorabbin), the west (Laverton, Derrimut, Truganina) and the north (Campbellfield, Somerton, Thomastown), with food, plastics, metal fabrication and the remaining automotive supply chain well represented. The sites are three-phase with a demand charge, often on a network tariff with a peak window in the late afternoon.
The sun is the other difference. A Melbourne roof makes roughly 1,250 kWh per kW a year, against about 1,450 in Brisbane and 1,600 in Perth. A 100kW system in Melbourne makes what an 80kW system makes in Brisbane. Winter output falls further than in the northern cities, so a factory with a steady winter load buys more grid power in June than a quote based on an annual average suggests. The interval data shows the month-by-month picture. See demand charges for the peak-window question.
What payback should a Melbourne factory expect?
Here is a worked example with example figures. They are not our prices and not a real site.
A 100kW system in Melbourne is assumed to make about 1,250 kWh per kW a year, so 125,000 kWh in total. Each kWh the factory uses itself saves $0.28. Each kWh sent to the grid earns $0.05. The example price is $73,000 after the STC discount, the figure used on commercial solar cost.
| Shift pattern | Solar used on site | Saved on purchases | Earned on exports | Yearly saving | Years to pay back |
|---|---|---|---|---|---|
| One weekday day shift, closed weekends | 70% | $24,500 | $1,875 | $26,375 | 2.8 |
| Two shifts, six days a week | 85% | $29,750 | $938 | $30,688 | 2.4 |
The sums: 125,000 kWh × 70% = 87,500 kWh used on site × $0.28 = $24,500, plus 37,500 kWh exported × $0.05 = $1,875. Total $26,375 a year, and $73,000 ÷ $26,375 = 2.8 years. The second row works the same way at 85%.
The Victorian Energy Upgrades discount is not in this table because its value moves with certificate prices. It comes off the price, so both paybacks shorten. Ask for it as its own line on the quote, with the certificate count and the price assumed.
These sums leave out demand charges, the slow wear of panels and future price changes. The same table by site type is on commercial solar cost, and the full shift-pattern table is on solar for manufacturing.
What to send for a Melbourne manufacturing proposal
Just one recent electricity bill, with every page. The pages after the amount owing carry your tariff, your demand charge and your meter number. We use the meter number to get your interval data ourselves, so there is nothing to request from your retailer. We check which of the five distributors the address sits on before sizing, and we price the Victorian Energy Upgrades discount on the day. From there you get a costed proposal with every assumption shown.
If you already have a quote, compare it line by line with our checklist. Otherwise, send your bill.
Questions from Melbourne manufacturers
Can my factory get the Victorian Energy Upgrades discount as well as STCs? Yes, for a system between 30kW and 200kW on a non-residential site, installed by an accredited provider under the program. The two are separate: STCs are federal and come off the invoice; the Victorian Energy Upgrades discount is state and is created as certificates for the installation. Above 200kW the program's project-based method applies instead. Both should appear as their own lines on the quote, with the certificate counts shown, so you can check each.
Why is a Melbourne quote for 100kW bigger than a Brisbane one for the same output? Because Melbourne's panels make about 1,250 kWh per kW a year and Brisbane's about 1,450. To make the same annual output a Melbourne system needs roughly 15 to 20% more panels. A proposal for a Melbourne roof that uses a Brisbane or Perth yield figure overstates the saving, and the payback with it. Check the yield line on any Melbourne quote first.
Which Melbourne distributor is my factory on, and does it matter? It matters for the connection process, the export limit and the timeline. Dandenong and the south-east are mostly United Energy, the western estates are Powercor, the north is Jemena, the inner city is CitiPower and the outer east is AusNet Services, but the boundary is by street, so we check the address rather than assume. Each publishes its own export limits, and some inner feeders cap a 100kW system.
Does Melbourne's winter wreck the payback? No, but it changes the shape of it. Output in June is well below the annual average, so a factory with a steady year-round load buys more grid power in winter than a flat annual figure suggests. The payback figures above use annual totals, which is the right measure over the life of the system; what matters is that the quote's annual output is a Melbourne figure, not a northern one.